Download a PDF Copy of this report
Are we nervous yet?
Stock indices reach record highs – again – so at least some defensive positioning is warranted…
In August, the equity markets were mixed as U.S. equities trended higher, while global markets were mostly lower. What makes this particularly interesting according to some analysts is that the big U.S. equity benchmarks scaled uncharted new heights in August, making this the longest bull market in history. Others dispute this claim, arguing that some previous bull market cycles were longer.
In the end, it doesn’t really matter. There is an old adage that’s been getting a lot of press time lately: “Bull markets don’t die of old age.” As clichéd as it sounds, that’s very true. When stock markets turn, and they will turn, it won’t be because they hit some predetermined time limit. It will be because there is an erosion in the fundamentals that causes investors to pull their money from equities.
We don’t know in advance what the trigger will be that makes investors realize that markets need to correct, and often, even with the benefit of hindsight, it is extremely difficult to pinpoint the exact cause. More often than not, the cause is something that very few people could identify in advance.
Yes, markets have been in an uninterrupted bull cycle since bottoming in February 2009. However, while returns have been strong, particularly in the U.S., they haven’t been parabolic. In a recent commentary, Outcome Wealth Management notes that outside of U.S. equity markets, which have gained an annualized 15.1% since the bull market began, performance in other markets has been more modest. For example, Canada has gained an annualized 4.9% in the period, Europe has an annualized return just shy of 7%, and Japanese stocks posted a 5.7% annualized return.
Granted, stock valuations are high, particularly in the U.S., but earnings growth, job creation, and GDP growth all remain positive. Credit markets too, which are often a strong predictor of equity markets, remain solid except for some pockets in Europe and the emerging markets. Obviously, we’ll want to stay on top of these to scout for any further erosion.
My point is that there is no reason to be worried about stock markets simply because they have been rallying for so long. Major indicators are still reasonably positive, and everything is fine – not great, not bad, but fine.
Still, there are reasons for concern, including valuation levels, trade disputes, U.S. President Donald Trump’s unpredictable outbursts in trade and foreign affairs, potential geopolitical tensions at any number of locations around the world, and, of course, the “Black Swan” event nobody foresees.
In this type of market, we need to remain measured in our approach and position our portfolios more defensively than we would at lower valuation levels or in a less “risky” environment. In this environment, I am not making any changes to my investment outlook.
Please send your comments to feedback@paterson-associates.ca.
Special Feature: Where to hide in down markets
How to get defensively positioned with low-volatility funds…
September and October have historically been the most volatile months in equity markets. With today’s valuation levels, trade wars, geopolitical uncertainty, and worries over a meltdown in Turkey and Argentina spilling over into other regions, the likelihood of higher volatility continues to rise.
While some may be tempted to sell all their equity exposure and move into the safety of cash or bonds, the reality is we don’t know when any such downturn in the markets will occur. If we sell out and fail to get back in at an appropriate time, we end up hurting ourselves more than had we stayed invested.
What I prefer to do in such situations is get a little bit more defensive in my equity market positioning rather than get out of the equity markets altogether. This will still allow me to benefit from equity exposure if markets continue to rally but will help protect my capital better in the event of a market selloff.
With that in mind, here are a few ways to position your portfolio in a more defensive way.
Foreign equity. The first thing I would do is to make sure that your foreign equity exposure, particularly U.S. dollar-denominated holdings, is unhedged. The reason for this is that in periods of high market volatility or a big equity market selloff, investors tend to flock to the U.S. dollar. With the U.S. dollar increasing in value, the losses are muted compared with an unhedged currency position.
A great example is 2008, when the S&P 500 fell by 37% in U.S. dollar terms. However, thanks to a sharp appreciation of the U.S. dollar relative to the loonie, the net loss for a Canadian investor with unhedged currency exposure would have been just over 21%.
Another way to help protect your portfolio would be through overweighting or underweighting more defensive sectors. The accompanying table, published by Capital Group, highlights the sectors that have outperformed and underperformed the S&P 500 in a sharp market selloff.
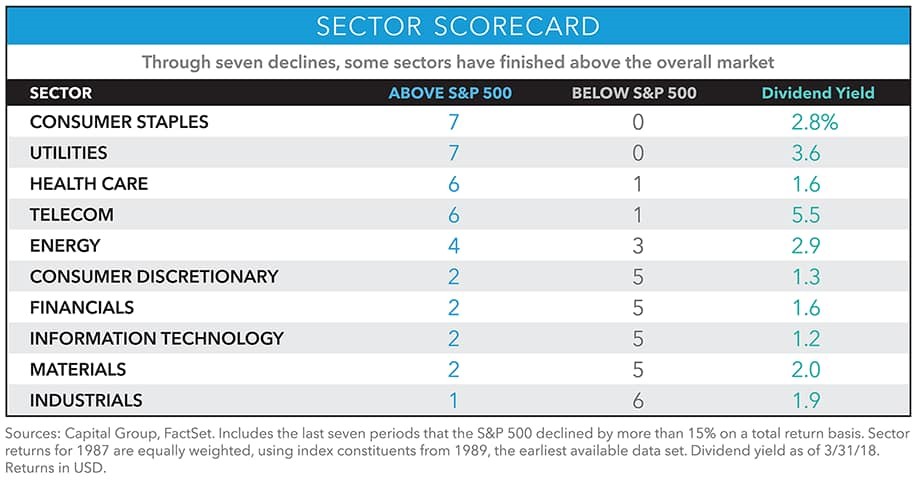
The two sectors that have outperformed most frequently in a market correction have been consumer staples and utilities. In the past seven market corrections, they have outperformed in each. The next best-performing sectors were healthcare and telecom, which outperformed in six of the last seven corrections. Intuitively this makes sense as these sectors tend to deal more in goods and services that are necessities, and are unlikely to be hit as sharply by an economic or market slowdown
For example, consumer staples are items that people are unable or unwilling to cut out of their budgets, evening times of stress. These include such things as food and beverages, and tobacco and alcohol.
Utilities – like power, heating, and water – are things that people need, regardless of their financial situation, and are unlikely to make dramatic changes to their consumption patterns.
Healthcare. If you get sick, you’ll go to the doctor and get what you need.
Telecom includes your phone, be it wireless or old-school landline. While you may look to cut back a bit, they are still largely necessities for most people.
Some sectors you’ll likely want to reduce exposure to include industrials, materials, and technology. Typically, these are the inputs to the manufacturing process, and as the market turns, it is highly likely an economic slowdown is on the horizon, which may dampen the demand for such products. Industrials have beat the S&P 500 only once in the past seven corrections, while materials and tech have outperformed only twice.
By overweighting the more defensive sectors, you’re likely to hold up better than the broader markets
A great way to do this is to look at some of the low-volatility funds that are available (see examples elsewhere in this issue). By their nature, low-volatility funds tend to be more defensively positioned as they will often build the portfolio based on a measure of risk rather than market capitalization. As a result, more defensive sectors tend to make up a larger portion of these types of funds, resulting in big overweights to consumer staples, utilities, and healthcare.
While this strategy won’t completely protect you against market losses, it has a very high probability of outperforming the broader markets. Furthermore, it still provides you with exposure to the equity markets, which will allow you to continue earning returns and participating in the upside of the market in the event the correction does not occur.
The drawback to this strategy is that if there is no selloff, your portfolio performance is likely to trail the markets, but not nearly as badly as it would have if you had switched all into cash or bonds.
.
Funds of Note
This month, I look at funds from Steadyhand, Invesco, Mackenzie, BMO, iShares & Vanguard…
Steadyhand Global Equity Fund (SIF 140 – No-Load Units) – On August 29, Steadyhand announced changes to the management of this fund. London-based Velanne Asset Management will be taking the reins from Edinburgh Partners. The change was prompted because lead manager Sandy Nairn had taken on an advisory role with Franklin Templeton’s global equity team, after Edinburgh’s takeover by Franklin Templeton. Steadyhand’s management became concerned that this additional role would detract from the time spent on the portfolio by Dr. Nairn, and felt this warranted a change
The new lead manager is Anne Gudefin, who was a long-time manager on the Franklin Mutual Global Discover Fund before leaving in 2009 to run a similar mandate at PIMCO. Ms. Gudefin’s approach is very much fundamental, value-driven, and contrarian. She looks to pick up quality companies when nobody else wants them, and then has the conviction to stick with them while the value is unlocked.
The low-turnover approach is expected to see a portfolio of roughly 50 names and will look much different than its benchmark. Her results as part of the Mutual team were excellent, delivering top-quartile performance with the Mutual Global Discovery Fund. However, her time at PIMCO was less impressive, and she left in 2016 to start her own firm after PIMCO opted to get out of global equities.
I am cautiously optimistic that this will be a positive change for the fund. However, given Ms. Gudefin’s short track record under her own shingle, I remain on the sidelines but will continue to monitor the fund. I will revisit in a few quarters once Ms. Gudefin has fully transitioned the portfolio and has had some time with it.
Invesco Senior Loan CAD Hedged ETF (TSX: BKL.F) – One of the questions I’ve received about this pick is why I still like it when a couple of others, namely Mackenzie Floating Rate Income ETF (TSX: MFT) and BMO Floating Rate High Yield ETF (TSX: ZFH), have outperformed it over the past year or so. For the year ending Aug. 31, BKL.F has gained 2.8%, while MFT is up 7.2% and ZFH is up 5.4%. To understand this significant differential, we need to look more closely at what these other ETFs actually do.
As a refresher, the Invesco Senior Loan CAD Hedged ETF is a passive ETF that invests in the 100 largest, most liquid senior bank loans issued in the U.S. In comparison, the Mackenzie Floating Rate Income Fund is an actively managed fund that invests in a portfolio of floating rate loans. The key with the Mackenzie ETF is precisely its active management. Manager Steve Locke and his team use a mix of top-down macroeconomic analysis, combined with quantitative and fundamental credit research to find what they believe to be high-quality loans that are trading at an attractive yield with the potential for modest capital gains. They focus on higher quality, non-investment grade mid-market issues that are trading below what they believe it to be worth.
The portfolio is actively managed, and loans are sold as they approach what the manager believes it to be worth. This combination of active management and mid-market focus allows the manager to generate higher returns in most market conditions. In addition, the manager may also make small currency bets as a way to opportunistically generate excess alpha.
The BMO Floating Rate High Yield ETF is different again. It provides exposure to a diversified portfolio of high-yield bonds through positions in a high-yield credit default swap index (CDX). CDX provides exposure to the credit movement of the underlying reference portfolio. Earlier in the year, credit spreads of high-yield bonds narrowed significantly, which has benefitted the BMO ETF. With very tight spreads, the potential upside is more limited, which may affect the future return. Furthermore, if we see a sharp and significant widening in spreads, the value of the ETF is likely to drop.
Looking ahead, I am continuing to dig into the Mackenzie offering. Thus far, I have been reasonably impressed with the manager and the investment process employed. I also understand that the recent spread tightening has been a net positive to MFT, and I will want to see how it performs in a more volatile credit market. It is on my radar and under serious consideration for inclusion on my ETF Focus List.
In the interim, I continue to favour the passive Invesco offering for its higher-quality investment portfolio, reasonable fees, and strong liquidity profile. I expect that if we see a significant credit event, this ETF is likely to hold up better than its peers.
iShares MSCI World Index ETF (TSX: XWD) – With a three-month return of 4.96%, this global ETF was one of the strongest performers in the Global Equity category. And this has been no fluke, as it has outpaced the other ETFs in the category in all time periods out to five years.
There have been two drivers of the return in the recent past. The first is the U.S. equity exposure, as U.S. stock markets have been among the strongest performers over the past year. Second, the currency exposure of this ETF is unhedged, providing a strong tailwind because the U.S. dollar has appreciated significantly against the Canadian dollar. Going forward, I expect the U.S. equity markets to continue to be strong in the near-term given the pace of corporate earnings and economic growth. By contrast, Europe and Asia are expected to continue struggling in the face of continuing trade tensions with the U.S.
This trade skirmish is also expected to continue weighing on the Canadian dollar. Until the trade file is settled, I reckon the Canadian dollar will continue to lag the U.S. greenback. Assuming a trade deal can be reached, the Canadian dollar could bounce back sharply and find a new higher level. In the event of a market selloff, the U.S. dollar would be expected to rally, which will allow this unhedged ETF to outperform a fully-hedged ETF. For smaller investors, this remains an excellent way to get a one-ticket global equity solution. Larger accounts can buy 60% XUS and 40% ZEA for roughly the same exposure at lower cost.
Vanguard FTSE Emerging Markets All Cap ETF (TSX: VEE) – Emerging markets have been under significant pressure in recent months on a number of fronts. Pressured by rising U.S. interest rates, a strengthening U.S. dollar, and the global trade dispute, investor sentiment has continued to worsen. Factor in Argentina’s recent fiscal woes, Turkey’s economic mess, Brazilian elections, and South Africa’s contentious land reform bill, and the fear of contagion in the emerging markets continues to spread.
While I am always reluctant to suggest trying to time the markets, there are far too many unknowns in the emerging markets now for me to be comfortable with any meaningful EM exposure. Instead, I would wait for the various situations to settle, providing some additional visibility around the overall fiscal health of the region.
If there is a fund that you would like reviewed, please email a request to me at feedback@paterson-associates.ca
September’s Top Funds
RBC QUBE Low Volatility Canadian Equity Fund
| Fund Company | RBC Global Asset Management |
|---|---|
| Fund Type | Canadian Equity |
| Rating | B |
| Style | Systematic Quantitative |
| Risk Level | Medium |
| Load Status | Optional |
| RRSP/RRIF Suitability | Good |
| Manager | Bill Tilford since November 2012 |
| MER | 1.85% |
| Fund Code | RBF 719 – Front-End Units |
| RBF 019 – Low-Load Units | |
| Minimum Investment | $500 |
Analysis: With the possibility that markets may get a little rocky heading into the fall, this fund, managed by Bill Tilford and his team at RBC, is a great way to get more defensive in the market while still having equity exposure. Like all low-volatility funds, it is designed to protect capital in a falling market environment, while providing reasonable gains in other environments.
The manager’s investment process is disciplined, rules-based, and quantitative. Each potential stock holding is first rated and ranked on several fundamental criteria designed to measure stability, growth, quality, and value. These criteria include both backward- and forward-looking factors. Managing valuation is critical because it will help preserve value better in market drawdown.
Once the stocks have been screened and scored, the team generates an internal risk forecast for each stock, which serves as an input in the optimization process. The manager then runs the first portfolio optimization to create the lower-risk portfolio that focuses only on risk. Once this has been determined, the manager will then run a second optimization that looks to create the portfolio with the highest risk-adjusted return.
The result is a diversified portfolio that looks much different than the index. It holds less than 75 names, with the top 10 making up just over 40%. Not surprisingly with its low-volatility focus, it is overweight consumer staples, utilities, telecom, and real estate, while maintaining significant underweights to energy, materials, and financials.
Given the focus on fundamentals, the portfolio appears to have more favourable valuation numbers than the index, while delivering a reasonable level of earnings growth. Volatility has been well below the index.
Shorter-term performance has struggled, but the longer-term numbers are very strong, outpacing the index and peer group over the past five years. The defensive positioning has been a headwind in the past several quarters. However, as the market focus returns to fundamentals, relative performance should improve. This is not out of character for a fund with a focus on downside protection. I fully expect that it will trail the market in a sharp rally.
Costs are reasonable, with an MER of 1.85% for the advisor-sold units, and 0.77% for the F Class units. Do-it-yourself units come in at just over 1%. In the Low Volatility Canadian equity space, this fund rates at or near the top of my list.
.
Horizons Active Canadian Dividend ETF
| Fund Company | Horizons ETF Management |
|---|---|
| Fund Type | Cdn Dividend & Income Equity |
| Rating | B |
| Style | All-Cap Blend |
| Risk Level | Medium |
| Load Status | N/A |
| RRSP/RRIF Suitability | Excellent |
| Managers | Sri Iyer – Guardian Capital |
| Fiona Wilson – Guardian Capital | |
| MER | 0.79% |
| Fund Code | TSX: HAL |
| Minimum Investment | N/A |
Analysis: This systematically managed ETF has delivered very strong absolute and risk-adjusted returns for investors since its launch in February 2010. Its 5-year average annual compounded rate of return to July 31was 9.6%, outpacing the S&P/TSX Composite, which returned 8.8% over the same period. For the past 12 months, it earned 12.6%, beating the 11.7% posted by the index.
Manager Sri Iyer and his Systematic Strategies team at Guardian Capital look for Canadian companies that have the ability to pay, sustain, and grow their dividends. The team uses a ruled-based screening process that analyzes 31 different factors, looking for positive rates of change. These factors focus on growth, payout ratios, efficiency, valuation, and investor sentiment.
The result is a well-diversified portfolio, holding around 60 names, with the top 10 making up just under 30% of the ETF. It invests in companies of any size, and has roughly 43% in big-cap names, with the balance in small- and mid-caps. The sector mix is dramatically different than the broader Canadian market, with an overweight in energy, consumer cyclicals, real estate, and utilities. It is significantly underweight financials, with modest underweights in consumer defensives and materials.
Valuation levels look a bit rich compared with the broader market and the peer group. However, the stronger-quality metrics, combined with the higher forward-looking earnings growth rate, more than offsets the higher valuation, making it one of the more attractive options in the dividend ETF category.
It has also been one of the least volatile in the category, while delivering well above average returns. Looking at the defensive positioning of the portfolio, there is nothing to indicate a higher level of volatility ahead.
The biggest knock on this ETF is its cost, with an MER 0.79%, which is well above the category average. Still, the alpha generated has more than offset this higher cost.
This remains one of my top picks for Canadian dividend ETFs. The fundamentally constructed Invesco Canadian Dividend ETF (TSX: PDC) is the other. I expect that with the focus on quality, both ETFs will hold up better than the broader market in the event of a selloff. Over the long-term, I continue to favour dividend stocks as a core holding for most investors.
.
iShares U.S. Fundamental Index ETF
| Fund Company | BlackRock Asset Management |
|---|---|
| Fund Type | U.S. Equity |
| Rating | C |
| Style | Large-Cap Value |
| Risk Level | Medium |
| Load Status | N/A |
| RRSP/RRIF Suitability | Good |
| Manager | BlackRock Asset Management |
| MER | 0.72% |
| Fund Code | AQN: CLU |
| Minimum Investment | N/A |
Analysis: Looking at the recent performance of this fundamentally-built ETF, it’s easy to dismiss it compared with other lower-cost, cap-weighted funds. But I don’t believe that the recent performance of the cap-weighted ETFs tells the whole story.
A significant portion of the cap-weighted return has been driven by a few mega-cap tech stocks like Facebook, Amazon, Apple, Netflix, and Google, which combined make up roughly 15% of the S&P 500. But along with soaring share prices, their valuation levels have also climbed.
For example, at the end of July Amazon was trading at more than 112 times forward earnings, while Netflix traded at just shy of 130 times. Clearly these levels are not sustainable over the long-term, and a correction will need to occur at some point. Moreover, the tech rally has pulled valuation levels of the broader U.S. equity market to the upper end of the historic averages, making the entire cap-weighted index ripe for a potential selloff.
One way to help insulate against this risk is to use an ETF that is built using a set of rules that moves beyond the size of a company, and this iShares offering may be just the ticket. The fund scores the U.S. equity universe on several fundamental metrics including dividends, free cash flow, sales, and book value. It holds about 1,000 positions, and the weight of each is determined based on its relative score. Those that score better comprise a larger portion of the portfolio than those that score poorly.
The result is a portfolio that is designed to have a fundamental makeup that is better than the index, offering attractive valuation, yield, and growth rates. While the valuation levels are significantly more attractive than the cap-weighted indices, the growth profile is a little less favourable, given the underweight positioning of some of the high flyers.
Although a cap-weighted ETF for U.S. equities has historically been an excellent choice, I believe that if we hit a period of extended volatility, the fundamentally constructed ETF will offer a more attractive risk-return profile. I expect this ETF will also outperform when the market focus returns to valuation and quality.
A concern with CLU compared with a cap-weighted ETF is its cost, with an MER of 0.72%, compared with 0.11% for XSP. While I believe this higher cost can be offset in a down market, it does act as a headwind in a flat or rising market environment.
.
TD Global Low Volatility Fund
| Fund Company | TD Asset Management |
|---|---|
| Fund Type | Global Equity |
| Rating | D |
| Style | Large-Cap Value |
| Risk Level | Medium |
| Load Status | Optional |
| RRSP/RRIF Suitability | Good |
| Manager | Jean Masson since Nov 2011 |
| Wilcox Chan since Nov 2011 | |
| MER | 2.48% |
| Fund Code | TDB 2541 – Front-End Units |
| TDB 2534 – Low-Load Units | |
| Minimum Investment | $500 |
Analysis: With markets trading at near-record highs, with much uncertainty in the air, the prospect of a meaningful correction is very real. With that in mind, this global equity offering is a great way to stay invested while looking to protect capital in the event of a major drawdown.
While the absolute return numbers have not impressed, the risk-adjusted returns are much more compelling. Living up to its promise, over the past five years, the fund has delivered performance in line with the index, but with much lower volatility, participating in much less of the downside than the index.
The fund is managed by a very well-staffed team headed by Jean Masson. Its go-anywhere mandate looks for stocks showing the least amount of volatility over the past 36 months. The managers also consider valuation when reviewing a potential opportunity.
The investment evaluation and portfolio construction process blends quantitative analysis with the judgment of the portfolio management team. In fact, the team will override the model in certain circumstances.
The portfolio is very well diversified with more than 250 names, and the top 10 making up less than 10% of the fund. It is built using an optimization process that aims for the best risk-adjusted return. The managers rebalance frequently, but balance risk reduction with trading costs, as they don’t want the friction from frequent trading to reduce the risk-reduction benefits.
Given the low volatility focus, the fund is overweight telecoms, consumer staples, and industrials, with a significant underweight to technology and healthcare. One byproduct is the very respectable 3.2% dividend yield, well above the yield offered by the benchmark. Geographically, the fund has about 10% in Canada, 40% in the U.S., and the rest in international equities.
Valuation metrics are very reasonable with a P/E ratio well below the broader market. With equity markets moving higher over the past few years, this more defensive positioning has been a significant headwind for performance. While this may be frustrating, it is what this and other low-volatility funds are designed to do. They will often trail markets on the way up, but outperform on the way down, resulting in very strong risk-adjusted returns over the long term, which I’d expect with this TD offering.
Cost is the biggest drawback with a 2.48% MER for the advisor units, while DIY units are 1.64%. However, fee-based units are reasonably priced, coming in at 1.03%.
All Rights Reserved. Reproduction in whole or in part without written permission is prohibited. Financial Information provided by Fundata Canada Inc. © Fundata Canada Inc. All Rights Reserved. Commissions, trailing commissions, management fees and expenses all may be associated with mutual fund investments. Please read the simplified prospectus before investing. Mutual funds are not guaranteed and are not covered by the Canada Deposit Insurance Corporation or by any other government deposit insurer. There can be no assurances that the fund will be able to maintain its net asset value per security at a constant amount or that the full amount of your investment in the fund will be returned to you. Fund values change frequently and past performance may not be repeated. The foregoing is for general information purposes only and is the opinion of the writer. No guarantee of performance is made or implied. This information is not intended to provide specific personalized advice including, without limitation, investment, financial, legal, accounting or tax advice.