PDF Copy of this Edition
What’s New
Many Investors sitting on big cash balances – According to a recent poll conducted on behalf of investment dealer Edward Jones, Canadian investors have 13% of their portfolios invested in GICs. Further, 25% of those surveyed said that they intend to buy GICs this year, further adding to their cash balances. GIC rates remain very low, with five-year GICs paying between 1.75% and 2.20% at the banks. Those willing to take on a bit more risk may want to consider one of the alternative providers. For example, ICIC Bank is offering 3.15%, while Home Trust is offer a rate of 2.55%. While we understand the appeal of cash, namely that you won’t lose money, the reality is that if you hold more cash than you need, your portfolio will not keep pace. For example, if you had invested only in a GIC, you would have made less than 2% for the past year. Had you been invested in our Couch Potato Portfolio, you would have made 7.3%. On a $50,000 portfolio, that adds up to an additional $2,653 in the past year. Had you been invested in one of our other portfolios, the return potential is even higher. The key is to find a portfolio mix that you are comfortable with, and get any excess cash working for you.
Greenfield promoted to Lead Manager on Trimark Global Balanced Fund – After serving as co-manager on the fund since September 2009, Invesco announced that Erin Greenfield has been promoted to Lead Manager of the Trimark Global Balanced Fund. Jeff Hyrich will continue to work in the role of co-manager on the fund. This change will not have any effect on the security selection process. Mr. Greenfield, based on the outlook of the entire Trimark Investment team, will set the asset mix. Fixed income will continue to be managed by the Trimark Fixed Income Team. We do not expect that this change will have a material change on the performance of the fund going forward.
Mackenzie Launches New Funds – After undertaking a massive reorganization of their fund lineup last month which saw the proposed merger of a number of existing fund, Mackenzie Financial announced that they have received the final approval for the launch of two new fixed income funds. The Mackenzie Strategic Bond Fund will have a flexible mandate, allowing it to invest in a wide range of fixed income asset classes, including government and corporate bonds, foreign government bonds, real return bonds, high yield bonds, and floating rate notes. At least 75% of the fund will be invested in investment grade bonds, with up to 25% allowed in non-investment grade bonds. The management fee will be 1.40% for Series A Units. Once taxes and administration fees are taken into account, we expect that the MER will be approximately 1.80%. The Mackenzie Floating Rate Income Fund will invest in floating rate loans. The coupon rates are often tied to a benchmark rate of interest, typically LIBOR. They can provide great protection against rising interest rates. The management fee is 1.60%, which we expect will result in an MER of approximately 2.0%. This is a touch high compared with other floating rate funds. Both funds will be managed by the Mackenzie Fixed Income team, which is headed up by Steve Locke. We will be taking a wait and see approach with both of these funds. We want to see some actual performance before we jump in, and we believe that there are other, more established funds that can offer comparable investment exposure.
ETF Recommended List Review
By Dave Paterson, CFA
Commodities continue to weigh on Canadian equities
Global markets continued their charge higher in the three months ending April 30. All major markets except Canada and China posted strong gains. The S&P/TSX Composite was down by 1% during the quarter as China struggles and a muted inflation outlook kept demand for commodities and gold in check. Materials and energy were sharply lower, while technology and consumer focused stocks pushed higher.
Global markets were generally strong. In the U.S., the S&P 500 gained 8.3% in Canadian dollar terms, while globally the MSCI World and MSCI EAFE gained 6.8% and 6.1% respectively. The strongest country performer was Japan, as weaker currency and aggressive government intervention spurred stocks higher. The MSCI Japan Index gained 18% in Canadian dollar terms.
Bonds were modestly higher, with the DEX Universe Bond Index gaining 2.6%. Long bonds outpaced shorter-term bonds, and corporate bonds bested governments. However, rumblings out of the U.S. that the Federal Reserve may bring its massive bond buying program to an end sooner than originally anticipated has pushed yields up sharply, resulting in losses to bonds thus far in May. While we don’t believe this signals a rapid return to higher interest rates, it does serve as a reminder that rates can move higher fairly quickly, and bonds, long thought to be a safe haven can post losses.
Looking ahead, our investment outlook remains fairly consistent. We continue to favour equities over fixed income given that we expect some upward pressure on rates. We don’t expect a return to interest rate levels that are near historical averages any time soon, but we believe the downside risks with fixed income definitely offset the upside potential. We continue to recommend that investors hold high quality, corporate focused, shorter duration fixed income in their portfolios as a way to help temper the volatility of the equity markets.
Within the equity space, we are becoming more concerned with Canadian equities, particularly the heavily concentrated S&P/TSX Composite. With many European economies continuing to struggle and economic growth out of China remaining well below trend, we expect that demand for commodities will continue to be soft. That will make it very difficult for the concentrated index to post strong gains. However, we still believe that there are other sectors of the Canadian market, specifically the consumer focused sectors that have potential to deliver strong gains. We continue to like the more fundamentally constructed ETFs within the Canadian market.
We continue to be positive on U.S. equities, but in some recent conversations with portfolio managers, some have expressed worries that the U.S. market may be fully valued. Most expect a pullback or a pause in the near term. Longer term however, corporate America remains very strong, painting a very favourable picture for the long term.
Within Europe and Asia, we remain cautious. While valuations may be more attractive than in the U.S., the headwinds caused by slower economic growth and continued uncertainty cause us to expect volatility levels will remain high in the near to medium term. Those who can stomach this higher level of risk may be wise to begin adding some global exposure to their portfolios. Those uncomfortable with volatility will want to avoid this region for the near term.
Overall, we remain cautiously optimistic on the investment outlook. Still, with the summer season soon upon us, volumes may be lighter and the markets may be prone to bigger swings than normal.
ETF Recommended List Highlights
During the quarter, there were no funds added to or deleted from the Recommended List
ETFs of Note
iShares Advantaged U.S High Yield Bond (TSX: CHB) – The difference in yields between high yield bonds and government bonds, referred to as the spread, has narrowed considerably in the past few weeks. It is at its lowest level since 2007. What this means is that the premium an investor receives to take on the additional risk of with high yield bonds has been lowered. When this happens, it suggests that high yield may be approaching full valuation. If you have held this ETF for some time and realized some gains, you may want to consider taking some profits by reducing your exposure.
BMO Low Volatility Canadian Equity ETF (TSX: ZLB) – As discussed elsewhere in this edition, there is significant evidence that shows contrary to popular belief, it is the least volatile stocks that have historically outperformed in the majority of market environments. This ETF is designed to benefit from that market anomaly and provides exposure to the 40 least volatile stocks, selected from the 100 largest and most liquid companies in Canada. With many investors looking to increase their equity exposure, a low volatility strategy may be just the ticket. It can provide strong risk adjusted returns with lower risk than the broader markets. Costs are reasonable, with an MER of 0.40%.
iShares S&P/TSX Canadian Dividend Aristocrats (TSX: CDZ) – With interest rates low, investor demand for yield continues unabated. This ETF can be useful in helping investors gain additional yield in their portfolios. It invests only in Canadian listed stocks that have increased dividends on an annual basis over the past five years. It pays a variable monthly distribution that at current prices is expected to yield in the ballpark of 3.3%. Total returns have been strong, and we expect that despite its small and mid cap focus, volatility, particularly to the downside will be lower than the index.
iShares MSCI EAFE Index C$ Hedged ETF (TSX: XIN) – In recent conversations with a couple of portfolio managers, they expressed the view that valuations in Europe and Asia are more attractive than the U.S. at the moment. While that may be true, there are still many macro factors that will keep these markets volatile. Still, for those with higher risk tolerances who can stomach the volatility, the time may be right for some exposure to Europe and Asia, and this ETF which tracks the MSCI EAFE Index is one of the best, lowest cost ways to access the region.
iShares U.S. Fundamental Index (TSX: CLU) – This ETF is designed to track the performance of the FTSE RAFE U.S. 1000 Index net of fees. Unlike the S&P 500, which is the 500 largest companies in the U.S., the RAFI indices are built using more fundamental factors such as distributions, cash flow and total sales. It is our opinion that in a more choppy environment, the more fundamentally sound companies should be able to deliver better risk adjusted returns. Despite its higher MER, we believe that this is a better option in the current environment for those with above average risk tolerance looking for U.S. equity exposure.
BMO Global Infrastructure Index ETF (TSX: ZGI) – More aggressive investors looking for additional return potential in their portfolio, may want to consider infrastructure investments. This ETF is designed to replicate the performance of the Dow Jones Brookfield Global Infrastructure Index, net of fees and expenses. While the volatility of the fund has been lower than the broader indices, we would expect that given the narrowness of the mandate, there may be periods of time where the fund could exhibit higher levels of volatility. In reviewing the overall risk reward profile of this ETF, we would suggest that it might be appropriate for medium to high-risk investors with a longer-term time horizon.
iShares Gold Bullion Fund ETF (TSX: CGL) – Gold has struggled of late and there are many short term factors which lead us to believe that it will be under pressure for the near to medium term. Long-term, the outlook is much stronger. We recently chatted with Kevin MacLean, the manager of the Sentry Precious Metals Growth Fund. He estimates that based on all the liquidity that has been injected into the global economy by the various central banks, the intrinsic value of gold is in the ballpark of $1,800 per ounce, significantly higher than current levels. He also believes that the intrinsic value is appreciating by approximately $20 per ounce each month. Still, it is our view that the short term will likely remain rocky and only those with a high risk tolerance should consider the sector at the moment.
ETF Recommended List
| ETF | FIRST MENTION | 3 mths ending Apr 30 | RESULTS (to Apr 30) | COMMENTS | ACTION |
|---|---|---|---|---|---|
| Fixed Income | |||||
| iShares 1-5 Year Laddered Corporate Bond (CBO) | Jul-12 | 1.4% | 1.9% (6 mth) | Short duration should outperform | Hold |
| iShares Advantaged U.S High Yield Bond (CHB) | Jan-12 | 3.2% | 12.6% (1 Yr) | Valuations high. Take some profits. | Hold |
| iShares DEX Universe Bond Index (XBB) | Dec-07 | 2.5% | 5.9% (5 yr) | Expecting modest returns at best from bonds. | Hold |
| iShares DEX Short Term Bond Index (XSB) | Aug-04 | 1.2% | 4.0% (8 yr) | Short duration provides downside protection | Hold |
| Canadian Equity | |||||
| BMO Low Volatility Canadian Equity ETF (ZLB) | Jan-13 | 9.0% | 9.0% (3 mth) | Low vol should outperform | Buy |
| PowerShares FTSE RAFI Canadian Fundamental (PXC) | Jan-13 | 0.0% | 0.0% (3 mth) | Fundamental ETF should do well long term | Hold |
| iShares S&P/TSX Completion Index (XMD) | Jan-12 | 0.4% | 3.3% (1 yr) | Big exposure to energy and materials may hurt | Hold |
| iShares S&P/TSX CDN Preferred Share (CPD) | Jun-09 | 1.0% | 7.4% (3 yr) | Expect modest returns in short term | Hold |
| iShares S&P/TSX Canadian Dividend Aristocrats (CDZ) | Sep-08 | -1.9% | 16.7% (4 Yr) | Demand for yield should continue to support | Buy |
| iShares S&P/TSX Capped Composite Index (XIC) | Dec-07 | -1.1% | 0.5% (5 yr) | Expect continued underperformance short term | Hold |
| Foreign Equity | |||||
| iShares MSCI EAFE Index (C$ Hedged) (XIN) | Jan-13 | 8.2% | 8.2% (3 mth) | Valuations look attractive relative to the U.S. | Buy |
| Vanguard MSCI U.S. Broad Mkt (C$ Hedged) (VUS) | Jan-13 | 7.0% | 7.0% (3 mth) | Very low cost exposure to U.S. large caps. | Hold |
| iShares Global Monthly Advantaged Dividend (CYH) | Jan-12 | 2.5% | 9.5% (1 Yr) | Demand for yield continues to give support | Hold |
| iShares US Fundamental Index (CLU) | Mar-11 | 8.1% | 9.8% (2 Yr) | ETF constructed on fundamental factors | Buy |
| iShares S&P 500 Index (XSP) | Dec-07 | 7.1% | 2.9% (5 Yr) | U.S. expected to continue to perform well | Hold |
| Specialty / Sector | |||||
| iShares US Fundamental Index (CLU) | Jan-13 | 2.7% | 2.7% (3 mth) | Great core option for smaller investors | Buy |
| iShares Gold Bullion Fund ETF (CGL) | Oct-12 | -12.0% | -14.7% (6 mth) | Short term outlook clouding long term potential | Hold |
| BMO Equal Weight REITs Index ETF (ZRE) | Jul-12 | 4.1% | 7.7% (6 mth) | Rally was in higher beta REITs. Hold for now | Hold |
| BMO Global Infrastructure (ZGI) | Jan-12 | 12.0% | 23.5% (1 Yr) | Great mix of yield and growth potential | Buy |
| iShares S&P/TSX Capped Financials Index (XFN) | Sep-09 | 0.5% | 5.0% (3 Yr) | Worries mounting over housing. Be wary | Hold |
| Note: Funds Highlighted in Green are Funds rated a Buy, while funds highlighted in Red are rated a Sell |
Couch Potato Portfolio Posts another positive quarter
By Dave Paterson, CFA
U.S. and International stocks continue to fuel gains
For the third quarter in a row, the Couch Potato Portfolio posted respectable gains, rising 2.36% since January. Continuing the trend, it was once again the foreign holdings that drove most of the gains. The iShares MSCI EAFE Index Fund (TSX: XIN) led the way higher, gaining nearly 7.4% in the quarter. Not far behind was the iShares S&P 500 Index Fund (TSX: XSP) which rose an impressive 6.75%. Bonds were modestly higher, with the iShares DEX Universe Bond Index Fund (TSX: XBB) gaining 2.08%.
Canadian equities continued to lag largely due to the continued weakness in commodities, which has weighed on materials and gold. For the past three month, the S&P/TSX Materials Index has fallen by nearly 20%, while the global gold index has plummeted by nearly 27%. Energy has also been weak, losing 2.5% during the same period.
Looking ahead, we see continued headwinds for Canadian equities. With the S&P/TSX’s concentration in commodity focused sectors, and a less than rosy near term outlook for gold and other commodities, we expect that the broader Canadian market will continue to struggle. However, that does not mean that all Canadian equities will underperform. We expect that those sectors that are less reliant on commodities, such as consumer stocks, healthcare and some industrials should continue to post decent returns.
We are also concerned about the fixed income environment. While rate increases are not imminent, they are much closer to reality than they were even a few months ago. There are real rumblings coming out of the U.S. Federal Reserve that their massive quantitative easing program will be coming to an end sooner than most had expected. When this does happen, it will push interest rates higher. Government bonds, which make up nearly 70% of the DEX Universe Bond Index, will be hit the hardest once rates begin to rise.
While the Couch Potato Portfolio has a very simplistic appeal, we do have some concerns about its potential returns going forward. It is our view that a portfolio that combines a mix of passive ETFs and actively managed funds will have the potential to deliver better risk adjusted returns into the future than a portfolio made up solely of ETFs. Specifically, based on our near term outlook, we continue to favour actively managed Canadian equity and fixed income funds over ETFs. It is our view that a high quality actively managed fund should be able to provide better risk-adjusted returns than a passively managed fund in those specific asset classes. We believe that a low cost, passively managed ETF remains a great choice for U.S. large cap equity exposure.
Here is the latest report on the couch potato portfolio performance. Results are based on the closing prices as of April 30, 2013.
| ETF | Shares Owned | Target Weight | Book Value | Market Value | Dividends Paid | Total Return since Inception |
|---|---|---|---|---|---|---|
| XBB | 140 | 40% | $4,019.40 | $4,425.40 | $898.62 | 32.46% |
| XIC | 140 | 30% | $3,015.30 | $2,756.60 | $358.60 | 3.31% |
| XSP | 82 | 15% | $1,489.94 | $1,502.24 | $93.24 | 7.08% |
| XIN | 55 | 15% | $1,500.40 | $1,115.95 | $120.15 | -17.62% |
| Totals | 100% | $10,025.04 | $9,800.19 | $1,470.61 | 12.43% |
Higher Risk doesn’t always mean higher returns
By Dave Paterson, CFA
Historically, low volatility stocks have outperformed in most markets
When it comes to investing, the relationship between risk and reward is about as basic as it gets. If you want to earn a higher return, you have to take on more risk. Right? Not exactly. There is a phenomenon in the equity markets known as the “Low Volatility anomaly” that has shown that on a historic basis, the opposite is true. It is in fact the lower risk equities that have performed better over time than more volatile stocks.
Let’s be clear, the low volatility anomaly only applies within asset classes, and equities in particular. The traditional view of risk and return still holds true across the various asset classes. Over the long run, stocks, with their higher risk tend to earn more than the lower risk bonds. Bonds, with their higher risk relative to cash, tend to generate higher returns.
Still, even within asset classes, we have always been taught that to earn more return, you have to take more risk. For example, big, blue chip, dividend paying stocks should offer up a return that is less than what you would expect to earn with high flying technology or mining stocks. If you weren’t going to earn that higher return, then why would you take on that extra risk? As it turns out, based on the numbers, it certainly appears that investors who take on that additional risk have not been adequately rewarded for doing so.
To learn more about this phenomenon, we spoke with Dr. Jean Masson, managing director at TD Asset Management (TDAM) and the lead manager on TD’s low volatility funds; TD Canadian Low Volatility Fund and TD Global Low Volatility Fund. TD has been one of the early adopters of low volatility investing and today manages more than $5.5 billion in the space.
“Looking at the performance numbers in Canada, low volatility strategies have outperformed the cap weighted indices more than two-thirds of the time”, said Dr. Masson. In fact, based on his research, it is only in months where the markets gain more than 4% in a month do the more volatile stocks outperform their less volatile peers.
This trend holds true across all major markets. In their research, TDAM found that in every case studied, overall volatility was reduced significantly, while still providing returns that are comparable or even better than the broader market. According to Dr. Masson, “We found that in the U.S. you can reduce risk by 30% and generate slightly higher returns than the traditional market index over a long period. We tested it in Canada and the results were even better.” Some of the TDAM findings are in the chart below which shows the simulated performance of low volatility portfolios compared with traditional market indices between January 2002 and December 2009.
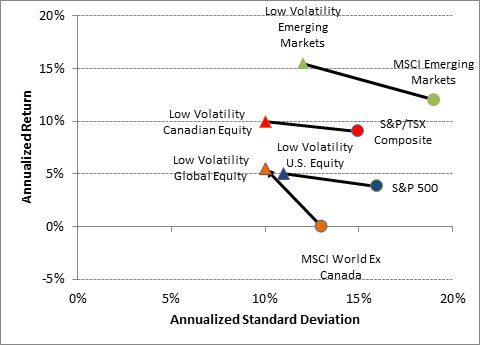
Source: “Risk Reduction: The Case for Low Volatility Equity Portfolio, November 2011”, TDAM, MSCI
While the low volatility anomaly holds true across all markets, it has been shown to be more effective in some. “We found that low volatility investing works better in markets where there is a lot of dispersion in the sector make up”, said Dr. Masson. This in part would explain why the trend has worked so well in Canada, where our market is heavily concentrated in energy and materials, both of which are very volatile.
Building a portfolio using the low volatility approach will result in a portfolio that looks much different from the index. For example, it is likely to have more exposure to the more mature sectors such as consumer goods, telecom and real estate, while having lower exposure to energy, materials, healthcare and technology. A byproduct of this is the low volatility portfolios tend to have a higher dividend yield than the broader market. The yield of the S&P/TSX Composite Low Volatility Index is listed at 3.8% compared with 2.9% for the S&P/TSX Composite Index.
Perhaps the most surprising aspect of a low volatility portfolio is how much exposure there is to small and mid cap companies. Intuitively, you would think that it would be made up of mainly big, well-established, blue chip companies. In reality, it is quite the opposite with the S&P/TSX Composite Low Volatility Index having a weighted average market capitalization that is roughly half of the broader index.
As with any market anomaly, our fear is that it won’t last forever. According to Dr. Masson, he doesn’t believe that it will either, but he does believe that it will be around for a while. A big reason for this is that a lot of portfolios continue to be benchmarked to the more traditional market indices, which while being “great at tracking the aggregate wealth of the market, they are not the best way to build a portfolios. “ In a whitepaper that was published in November 2011, they state that the low volatility effect may diminish once more portfolios are benchmarked using risk adjusted returns, but until that happens, “there is a window of opportunity for investors, and the first mover rewards may be significant.”
Bottom Line: Despite its relatively short track record, there is significant academic research showing that low volatility investing has the potential to deliver comparable returns with less volatility than with more traditional indexing techniques. The math just makes sense. For example, if you lose 20% of the value of your portfolio, you will need a gain of 25% to get back to even. However, if you lose 50% of your portfolio, you will need to double your money just to get back to even. With a low volatility strategy, you can win over the long term, just by not losing as much.
It is our opinion that these types of products can be a good core holding for many investors. Still, if you are going to invest in the strategy, you must be willing to accept lower returns in a rising market in return for the better returns in flat and falling markets.
Over time, it will be shown that not all of these funds are created equally. You must conduct the same due diligence you would on more traditional investments with low volatility funds. You must have a thorough understanding of the stock selection process, and given the more passive nature of many of these funds, investors are also advised to pay attention to the cost.
Low Volatility Investment Options
By Dave Paterson, CFA
Only a handful of options currently available
As shown in the article above, there is a fairly compelling case to invest in mutual funds or exchange traded funds (ETFs) that follow a low volatility investment strategy. Except for a sharply rising market, the low volatility funds will be expected to outperform the funds and ETFs that are built using the more traditional indexing methodologies.
Despite the strong argument, there are only a handful of investment low volatility options available, and all are relatively new. While each fund is designed to provide low volatility exposure, each is constructed using a slightly different methodology. With very little track record, it is difficult to say which of these funds is “best”, but all have done well since their launch.
Let’s take a look at a few of the mutual funds and ETFs that are available.
BMO Low Volatility Canadian Equity ETF (TSX: ZLB) – Launched in October 2011, this ETF was the first low volatility ETF in Canada. It holds the 40 lowest beta stocks from the 100 largest and most liquid stocks in Canada. Beta is a measure of relative volatility, with the index having a beta of 1. A beta of more than 1 means the stock is more volatile than the market, while a beta of less than 1 means it is less volatile. Performance has been very strong, returning 19.1% for the year ending April 30, strongly outpacing the S&P/TSX Composite, which gained 4.5%. The cost is very reasonable, with an MER of 0.40%. The portfolio is rebalanced every six months, and they rerun their model every year in December, ensuring that the stocks in it are still the least volatile.
TD Global Low Volatility (TDB 2540) – TD was the first to bring low volatility investing to Canada with a number of funds aimed at the pension market. This fund is their first retail focused offering. It was launched in November 2011, and has attracted nearly $3 billion in assets. The managers use their proprietary risk model to gain a better understanding of the true volatility of an investment. They then factor in trading costs and other risk controls, and run their optimization model to build the portfolio that offers the lowest expected volatility. With the entire world as its investment universe, the fund will hold a minimum of 120 different names, with controls in place to ensure it is properly diversified. One potential drawback of this fund is its cost, with an MER of 2.52%. While that is in line with the global equity category average, it is our view that it is a touch high for a more passively managed product. Still, we believe this is a great option for those looking for a low volatility option.
PowerShares S&P 500 Low Volatility CAD Hedged ETF (TSX: ULV) – This ETF is designed to provide exposure to the 100 stocks from the S&P 500 that have the lowest realized volatility over the past 252 trading days. The index is rebalanced on a quarterly basis. Performance has been strong, gaining 22.5% for the past year, handily outpacing the S&P 500. Costs are very reasonable with the management fee capped at 0.35%.
PowerShares S&P/TSX Low Volatility CAD Hedged ETF (TSX: TLV) – This ETF is designed to provide exposure to the 50 stocks from the S&P/TSX Composite Index that have the lowest realized volatility over the past 252 trading days. The index is rebalanced on a quarterly basis. Performance has been strong, gaining 14.2% for the past year, handily outpacing the S&P/TSX Composite Index. Costs are very reasonable with the management fee capped at 0.30%.
In addition, there are other low volatility funds that have been launched in the past few months. They include TD Canadian Low Volatility (TDB 2720), RBC QUBE Low Volatility U.S. Equity (RBF 488), RBC QUBE Low Volatility Canadian Equity (RBF 499), RBC QUBE Low Volatility Global Equity (RBF 487), and BMO Low Volatility U.S. Equity ETF (TSX: ZLU).
Fund Category Confusion
By Dave Paterson, CFA
Category names leave some readers puzzled
The other day, I had a conversation with a reader who was confused and frustrated by the different fund categories used by the different data providers such as Morningstar, Fundata and Globefund. With more than 50 different categories, it is not hard to see why there would be confusion.
The categories are determined by the Canadian Investment Funds Standards Committee (CIFSC), which was formed in 1998 to standardize the classification of Canadian sold mutual funds. For the most part, the fund categories are fairly straightforward. For example, it is not too tough to figure out what is in a fund in the European Equity category or the Canadian Short Term Fixed Income category.
Unfortunately, not all the categories are quite so straightforward. This is particularly true in a couple of asset classes; Canadian equities, and balanced funds. To help ease a bit of confusion, I thought it might be helpful to provide a quick overview of some of the more confusing fund categories.
First, let’s take a look at the Canadian equity categories.
Canadian Focused Equity – This is the most popular of the Canadian equity categories and is made up of funds that invest at least 50%, but no more than 90% of its assets in Canadian equities. When you start to look at the concentration within the Canadian stock markets, it is not hard to see why many managers would want to invest outside of our borders. First, there is very heavy concentration within three sectors; financials, materials, and energy. This means that there are many more opportunities in other sectors abroad. Second, our stock markets are relatively small, and there are only a limited number of stocks that have any level of trading volume. Once a fund reaches a certain size, it makes sense for the manager to start to look elsewhere for opportunities.
Canadian Equity – This is what many of us think of when we think of a Canadian equity fund. In this category, a fund must invest at least 90% of its holdings in equity securities of companies that are domiciled in Canada.
Canadian Dividend and Income Equity – Just to keep things interesting, they have added a dividend and income equity category into the mix. Unlike the previously mentioned Canadian equity categories, these funds emphasize income over growth. At least 70% of the fund’s equity holdings must be in Canadian equities, and at least 50% of the non cash holdings must be in securities that have a yield that is more than the three year weighted average yield of the S&P/TSX Composite Dividend Index. There are a few cases where a fund you would think would fit into this category is actually in one of the other two categories. A couple of examples would include AGF Canadian Large Cap Dividend and Stone & Co. Dividend Growth, both of which are classified as Canadian Focused Equity Funds.
This is not exclusive to the large cap realm. There are two small/mid cap fund categories; Canadian Small Cap Equity and Canadian Focused Small/Mid Cap Equity. The thresholds are identical to the large cap funds. A Canadian Small/Mid Cap Equity Fund must have at least 90% of its equity holdings in Canadian small/mid cap equities, while the Canadian Focused Small/Mid Cap Equity fund must be in the 50% to 90% range.
Another source of confusion is with the various balanced categories, where excluding the target date and asset allocation categories, there are six different balanced fund categories. Although, once you start digging into the details it is not as complicated as it first appears.
The first level of distinction is between Canadian balanced funds and global balanced funds. To be considered a Canadian balanced fund, at least 70% of its assets must be invested in Canada. Global balanced funds will invest less than 70% in Canada. Next, we take a look at the asset mix of the funds.
Fixed Income Balanced – As the name suggests, a fixed income balanced fund is heavily weighted towards fixed income investments. To fit in this category, it must have at least 60% invested in fixed income and cash. Equity holdings must be between 5% and 40%.
Neutral Balanced – Neutral balanced funds tend to be more of what we think of when we think of balanced funds. These are the funds that will hold between 40% and 60% in equities at any given point.
Equity Balanced – As you would surmise from the name, these funds are more focused on equities. They must invest between 60% and 90% of the fund in equities.
Bottom Line: At first glance, the fund categories can seem confusing and in some cases even unnecessary. But when you start working with them on a regular basis, you soon realize that there is a great deal of logic involved in the classification process. While it may seem unnecessary to have the various Canadian equity categories, it helps simplify matters once you understand the differences. To learn more about the various fund categories, check out www.cifsc.org.
IN MEMORIAM
By Gordon Pape
Shirley, my beloved wife of 51 years, passed away peacefully on June 2. I was with her along with our three children when she left us. Shirley was a strong, courageous, and loving wife, mother and grandmother. Although she was in weakened health in her latter years, she never lost her sense of humour, her infectious smile or her prodigious memory. She could recall in an instant events in our lives that had long slipped into the backwaters of my brain.
She leaves behind nine grandchildren, all of whom she adored. She loved being with them, listening to their stories and accomplishments, watching them grow and flourish, and marvelling at the special talents and abilities each displayed.
And she loved life – the smell of fresh roses, a sip of fine wine, catching a trout at our fishing club, watching the Blue Jays, being with friends, gazing across the bay at our Florida home as the moon rose, and, above all, being with her grandchildren.
She wasn’t ready to go. We weren’t ready to lose her and we all miss her terribly. Be at peace, my love. Somewhere, some day, we’ll be together again. All my love, Gordon.
Mutual Funds / ETFs Update
Editor and Publisher: Dave Paterson Circulation Director: Kim Pape-Green
Customer Service: Katya Schmied, Terri Hooper
BuildingWealth’s Mutual Funds / ETFs Update is published monthly.
Copyright 2013 by Gordon Pape Enterprises Ltd. and Paterson & Associates
All rights reserved. Reproduction in whole or in part without written permission is prohibited. All recommendations are based on information that is believed to be reliable. However, results are not guaranteed and the publishers and distributors of Mutual Funds Update assume no liability whatsoever for any material losses that may occur. Readers are advised to consult a professional financial advisor before making any investment decisions. Contributors to the MFU and/or their companies or members of their families may hold and trade positions in securities mentioned in this newsletter. No compensation for recommending particular securities or financial advisors is solicited or accepted.
Mail edition: $139.95 a year plus applicable taxes. Add $30.00 for delivery outside Canada.
Electronic edition: $69.95 a year plus applicable taxes.
Single copies: $15.00 plus applicable taxes.
Reprint permissions: Contact customer service (416) 693-8526 or 1-888-287-8229
Change of address: Please advise us at least four weeks in advance, enclosing the address label from a recent issue. Send change of address notice to:
Mutual Funds / ETFs Update
16715-12 Yonge St. Suite 181, Newmarket, ON L3X 1X4
Customer service:
By mail to the address above.
By phone to Katya or Terri @ (416) 693-8526 or 1-888-287-8229
By email to customer.service@buildingwealth.ca